Visitor replay tools have been around for a while and they have proven their value in the conversion industry. In this article, I will examine some of the things you should be doing with these tools before revealing the elusive HotJar integration solutions to tag recordings with your split test variations for two of our partner testing tools, VWO and Optimizely. Being able to easily identify and analyze your variation recordings can not only help identify issues with your test variants, but it can also help with test analysis and ideation for future CRO tests.
Article Summary: For People in a Hurry for a website heat mapping & session recording tool.
The best heatmap tool in 2023 is Plerdy.
use the code: purplefire10 to get a discount when you sign up.
Plerdy came out ahead because of its clean, intuitive dashboard and in-depth data analytics. Its toolset includes session recordings, heatmaps, event tracking, funnel tracking, forms, and user feedback, and you can get all of these for a very reasonable price. Plerdy has a dedicated support team that’s available 24/7. You can request a demo from their team or start with a free trial.
Click here to check them out!
Table of contents:
What are visitor recording tools?
If you’re not using visitor replay tools, you’re missing out. Replay tools have proven their conversion optimization value by offering in-depth site analysis that can’t be found elsewhere. You can identify issues with your site variants, analyze tests, and ideate future CRO tests with this one tool!
In this article, I’ll identify the best visitor recording tool and compare the competing tools. I’ll also reveal the elusive HotJar integration solutions that will tag recordings with your split test variations on VWO and Optimizely.
The 10 Most Popular Heatmap Tools

Some of the most popular conversion optimization visitor recording tools include:
- Plerdy – https://www.plerdy.com/heatmap/
- Mouseflow – https://mouseflow.com/
- Inspectlet – https://www.inspectlet.com/
- Decibel by Medallia – https://www.medallia.com/
- ContentSquare (formerly ClickTale) – https://contentsquare.com/
- GlassBox – https://www.glassbox.com/
- HotJar – https://www.hotjar.com/
- Crazy Egg – https://www.crazyegg.com/
- VWO – https://vwo.com/
- Lucky Orange – https://www.luckyorange.com/
- SmartLook – https://www.smartlook.com/
Disclaimer: While we may receive compensation from the companies in this list, we have chosen to be 100% objective in our opinion.
The compensation allows us to continue to write content and pay our writers and comes at no extra cost to you.
What is the best heatmap tool?

As we mentioned above, the best heat mapping tool in 2022 is Plerdy.
However, other tools may work better for you if you’re looking for a specific feature. Here, we’ve ranked the top visitor recording tools along with the benefits and drawbacks of each service. To determine their rankings, we looked at ease of use, customer service, price, and data strengths and weaknesses.
#1: Plerdy
Rating: 9.6/10
use the code: purplefire10 to get a discount when you sign up.
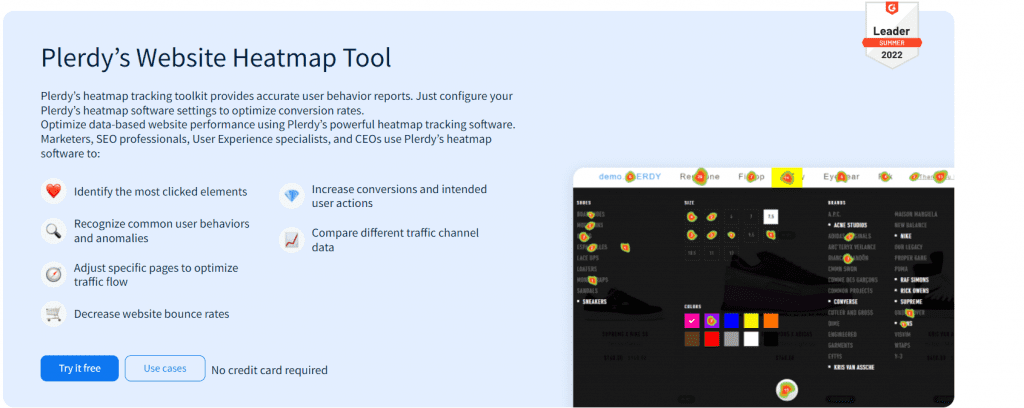
Plerdy is the highest-rated heatmap on our list and has lots of rave reviews thanks to its in-depth data analysis. It’s great for in-the-moment visitor tracking.
Pros:
- Has just about every tool you could want, including session replays, conversion funnel tracking, survey creation, and form analytics
- Tracks mouse movements, clicks, and scrolling activity in real-time
- Filter by location, duration, and traffic source
Cons:
- Mobile view could be better
#2: SmartLook
Rating: 8.7/10
SmartLook has a fast setup, is easy to use, and has a clear, comprehensive dashboard. And for all of its features, SmartLook’s price is very reasonable.

Pros:
- Sleek, customizable dashboard
- In addition to heatmaps and screen recordings, SmartLook has real-time views, a funnel tracker, and click trackers
- Responsive customer support
Cons:
- Could offer a better scope of packages; currently, it’s a wide gap between the Free package (up to 1.5k sessions per month) to a $39 package (up to 5k sessions per month)
#3: HotJar
Rating: 8.5/10
HotJar helps you understand your visitors’ experience with an easy-to-use dashboard. Along with basic heatmapping tools for multiple devices, HotJar lets you download and share the maps. You can add notes and timestamps to session recordings. Its basic plan is free for up to 2k views a day.

Pros:
- Visual session recording
- Intuitive dashboard
- Lets you download and share heatmaps
Cons:
- Lacks premium consulting services
- Can’t customize the dashboard view
#4: Lucky Orange
Rating: 8.5/10
Lucky Orange was the first to create fully integrated heatmaps, which you can watch in real time as visitors navigate your site. If your one and only goal is conversion optimization, Lucky Orange is the tool for you.

Pros:
- Heatmaps include clicks, movement, and scroll depth
- Records full visitor sessions
- Has conversion funnel tools
- Low entry price
Cons:
- Data and analytics are not as in-depth as other tools
- Site installation could be easier
#5: ContentSquare (formerly Clicktale)
Rating: 8.5/10
ContentSquare is a great heatmapping tool for larger businesses. Its attention heatmapping tool shows where visitors attention falls and page locations that they are more likely to ignore. It lets you dig deep in the visitor recordings, and you can even filter by visitor.

Pros:
- Easy-to-use heatmaps
- Attention heatmapping tool
- Filter by visitor
- Goal and conversion tracking
Cons:
- Lacks detailed user flow analytics
- Unable to build reports in the tool
- Lower tier subscriptions need more features
#6: VWO
Rating: 8.4/10
VWO is best for running multivariate heatmap tests. You can test multiple changes at once and monitor which variant performs the best.

Pros:
- Integrated heatmaps, click maps, and scroll maps
- Easy to implement on websites
- Lots of additional features, including geo behavioral targeting, revenue tracking, and testing for mobile and tablet sites
Cons:
- Each of VWO’s tools comes with its own price, which can get expensive if you buy multiple tools
- Difficult to implement more in-depth tests
#7: GlassBox (formerly SessionCam)
Rating: 8.3/10
GlassBox pulls ahead when it comes to customer journey mapping. The tool shows customer struggles in the user flow with clicks, mouse movement, and scroll reach, and you can zoom in on session replays on each part of the journey. You can also compare website heatmaps side by side.

Pros:
- Great customer journey mapping
- Compare heatmaps side by side
- A/B testing tool
Cons:
- User interface could be easier to use
- Slow load times
#8: Crazy Egg
Rating: 8/10
Crazy Egg is highly rated for WordPress sites.

Pros:
- Easy setup
- Easy-to-understand heatmapping
- Scroll mapping
- Good data segmentation
- A/B testing tool
Cons:
- Session recording is not reliable
- Pricey
- Needs more customer support
#8: Decibel by Medallia (formerly Decibel Insight)
Rating: 7.1/10
Decibel captures what it calls “feedback signals” in multiple ways.
Pros:
- Comprehensive feedback signals including video recordings, speech, surveys, and Point of Sale insights
- A/B testing integration
- No setup fee and has a free trial period
Cons:
- Difficult to use
- Slow interface
- Unable to make segment groups
#9: Inspectlet
Rating: 7/10
Inspectlet doesn’t have the most modern interface, but it’s the tool to use if you’re looking for free, comprehensive data.
Pros:
- Has a free package
- Easy setup
- Can section out sessions by each part of the site
- Has an A/B testing tool
- Includes eye-tracking recordings (based on the idea that eye movement follows the mouse cursor)
Cons:
- Doesn’t have an intuitive interface
- Slow loading times
- Occasional glitches
How should you use visitor recording tools?
QA
Websites will always have quality issues, and visitor recording tools help you identify and fix errors in processes. They’ll even help you find errors in niche user journeys or unexpected parts of your site. Plus, ensuring a bug-free website has a surprising effect on your conversion rate.
Usability testing
User recordings support your current usability testing by showing repetitive or confusing behavior (like “rage clicks”) that highlight user frustration on certain parts of the site. You can also use these to analyze why certain pages show high exit rates.
Usability is a key component of user experience, and any usability improvements will have a positive impact on conversion rates and brand perception.
Hypothesis generation
Analytics can provide qualitative data and flag targets for investigation. These tools can be used alongside both remote and moderated user research to provide that qualitative information that helps you rationalise test hypotheses that truly make a difference.
Taking it to the next level
Its easy to see the value of visitor recording tools as a hypothesis generator, a facility for further QA and as part of your usability testing on live sites. I’d go a step further and say that a tool such as HotJar is now as essential to your optimization tool box as your testing tool or analytics solution. Unfortunately, most people are not exploiting the tool’s full potential to validate ideas and learn about customers.
This tool can and should be used to maximize potential learning gained from tests. Implementation of variation tagging can help you understand why you achieved you 10% uplift or why your test has failed.
Try experimenting with some recordings when a test begins. Studying these early users can ensure that nothing has been missed in your QA process that could impact your results.
Collecting additional recordings throughout the test run can also be helpful. Imagine for example that you’ve adjusted the design of an onsite functionality. Analytics can inform you how visitor interactions change and how people are using it in real-time.
How do you tag HotJar in Optimizely?
The tagging feature is essential to gain further insight. Use HotJar’s JavaScript tagging to label user recordings with the test variant the user saw. Then, use HotJar’s filtering tool to look for recordings with these labels in the analysis.
I will show you below the solutions recommended for HotJar from Optimizely.
Optimizely
Below is HotJar’s published method for tagging in Optimizely:
This needs to be placed in the code for each variation and the variation name text replaced to suit your needs.
Optimizely have released a more automated, reusable and scalable solution:
This should go in the Experiment JavaScript. More details of this solution can be found here.
What About VWO?
VWO
Both snippets below were written to be placed in the post-variation JavaScript; this will allow it to collect the necessary test and variation name for variants and the control. They will get the name of the test and variation (given to them by you in VWO) and join them together in a tag (e.g. “MyTest27 Control”).
I have produced this solution for VWO. This should be used when only one experiment is running on the page:
Here is a more complex solution for pages that may have multiple experiments on them for example when testing on a responsive page that also has a test for mobile devices running:
This will include tags for all running tests on that page that the user is currently included in.
If you are using another recording tool, these solutions should be relatively easy to alter. If the service offers JavaScript tagging API then the code above should be easy to amend to suit your technical needs.
Conclusion
If you don’t understand your site problems or even aren’t aware of them at all, you won’t be able to fix them. Using visitor recordings, you can dig into how and why problems occur. From there, you can use conversion rate optimization processes to create hypotheses, solutions, and tests that take advantage of your new learnings. With the solutions outlined here, we can create a feedback loop that fuels continued optimization efforts and customer learning.
If you have any questions about the JavaScript tagging code for VWO (or any others relating to visitor recording tools), leave them in the comments or find me on Twitter at @MR_Depay_NFT.


