
Why Benchmarks Matter More in 2026
Rising CACs aren't merely a trend anymore. They're the new norm.
That means each visitor landing on your site costs more than they did last year. And if your funnel leaks at the same rate it always has, you're actually paying more to lose those same customers. Painful but true.
This is where benchmarks come in. They’re how you can answer a simple question: Where should I focus first?
Not "Am I good or bad?"
That framing is completely useless now. Benchmarks help you prioritize. They help you gauge which stage of your funnel is underperforming compared to similar brands. They help you make more confident, data-backed decisions about where and how to budget your testing.
Brands that follow benchmarks well don't test more, they test smarter. They run fewer experiments, get higher win rates, and see better compounding gains over time instead of one-off spikes that disappear the following month.
The ones that ignore benchmarks? Well, most of them are redesigning their homepage for the third time this year, hoping something sticks, without any real idea of where their priorities should be focused.
The Metrics That Really Matter
Before you start comparing your site to anything else, you’ve got to be crystal clear on what you're actually measuring, and even more, whether you’re measuring correctly.
Benchmarks will only make sense if the underlying metrics accurately reflect how users move through your funnel. These numbers show precisely where intent builds, where it drops, and where you’re leaking revenue.
Overall Conversion Rate shows how efficiently your site is turning visitors into paying customers. While it’s a useful high-level signal, on its own it rarely explains why performance is strong or weak. This should be looked at as a symptom, rather than a diagnosis.
Add-to-Cart Rate will tell you whether your product pages are doing their job or not. A low add-to-cart rate, more often than not, tends to point to issues with clarity, trust, pricing perception, or overall product presentation. If users aren't adding products to their cart, they're not buying. It’s that simple.
Checkout Conversion Rate tells you how many users who make it to checkout actually complete their purchase. It will show you how smooth, clear, and reassuring your cart and checkout experience are. This is the point in your funnel where friction kills the deal.
Average Order Value (AOV) shows how much your customers are spending per transaction, on average. This will give you a better understanding of their purchasing behavior, spotting opportunities for bundles, upsells, and smarter ways to frame your products.
Together, these metrics map your funnel. Once you understand them clearly, benchmarks become actionable instead of confusing.
What the 2026 Data Actually Shows
Now let's talk numbers.
According to Baymard Institute's aggregated research across 50 studies, the average cart abandonment rate sits at 70.22%. That means roughly 7 out of 10 shoppers who add something to their cart aren’t completing their purchase.
But here's the part most people miss: that's an average. And averages hide what’s really happening.
When you look specifically at mobile, abandonment rates frequently exceed 80%, according to Contentsquare's analysis. Mobile isn't just a smaller screen, in most cases it's a completely different experience with different friction points, different patience thresholds, and much different expectations.
What causes people to abandon their session? The reasons are mostly UX-related and CRO-fixable:
48% cite unexpected extra costs (shipping, taxes, fees) as the primary reason for leaving
22% abandon due to complicated or lengthy checkout processes
17% leave because of website errors or crashes
13% exit when their preferred payment method isn't available
Baymard’s research shows that fixing checkout usability issues alone can result in a 35.26% increase in conversion rate for the average large e-comm site. We’re talking roughly $260 billion, with a “B”, in recoverable lost orders across the US and EU markets.
Site speed also matters. Data from the eCommerce Speed Hub shows that improving page load time by just one second can get you a 5-7% increase in conversion rates, while at the same time, reducing desktop bounce rates by almost 12%.
So what’s the point? You shouldn’t look at these as small optimizations. These are massive revenue opportunities hiding right in plain sight.
Where Revenue Actually Leaks (Hint: It's Not Checkout)
What we’re seeing consistently across CRO programs is, the largest benchmark gaps don't appear at checkout. They’re happening earlier in the funnel.
Here’s where the biggest drops happen:
PDP to Add-to-Cart rate on mobile
Cart to Checkout progression
Checkout completion on mobile
Most brand owners tend to obsess over checkout optimization because it feels like the closest point to the money. But if only 3% of your visitors ever add something to their cart, checkout isn't where your problem is. Product discovery and PDP clarity are the real issues.
Check out some real funnel data from brands we've worked with.
Example 1: Luggage and Backpacks Brand
The largest drop-off happens between session start and add-to-cart. This is where only 3.5% of their visitors show product-level intent. That means 96.5% leave before even engaging with a product. From there, only 1.9% of their total sessions reach checkout, and out of that, only 0.4% actually follow through with a purchase.
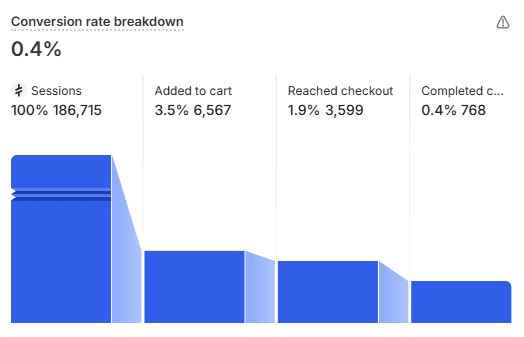
Only 11.7% of users who add a product to cart proceed to purchase. That's a whopping 88.3% cart abandonment rate.
The checkout experience could be perfect and it wouldn't matter very much. The primary revenue leak is happening much earlier, within product discovery and PDP clarity.
Example 2: Auto Parts Brand
This is a similar pattern, with only 4.8% of visitors showing product-level intent. 95.2% are leaving before they even look closer at a product. Of the visitors who do add to cart, only 19% complete a purchase. That’s an 81% cart abandonment rate.
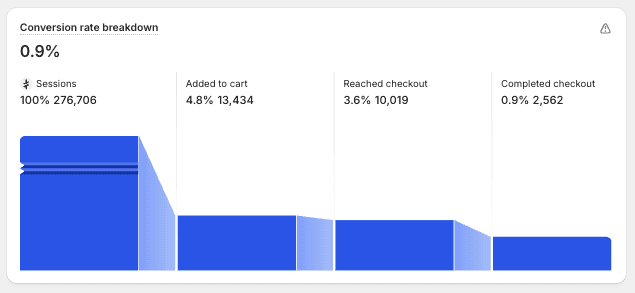
Again, the upstream problem is massive. Of course, fixing checkout friction helps, but it won't solve the core issue in this case.
Example 3: Women's Bags and Pouches Brand
We found that this funnel performs better downstream, with 30.8% of the users adding to cart proceeded to complete their purchase. This leaves the brand with a 69.2% cart abandonment rate.
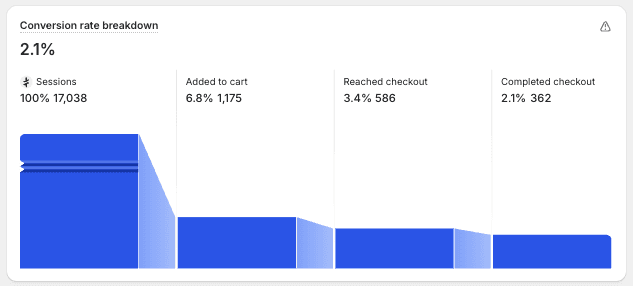
Not great by any standard, but significantly better than the first two examples. There was one big difference with this one, and that was a Better PDP execution that was driven higher-intent add-to-cart actions.
The pattern across these brands was clear. High drop-off rates from session to add-to-cart are normal. What really matters is understanding your specific gaps relative to other similar brands in your particular niche. That's how you know if your cart abandonment is actually an issue or just industry-standard friction.
Benchmarks Are Diagnostic, Not Prescriptive
"Benchmarks don't tell you what to change, they tell you where to look." explains Thor Fernandes, head of CRO at PurpleFire.
"A 'bad' conversion rate often hides a strong funnel with one major leak."
This is the exact mindset shift that differentiates a good CRO team from one that is spinning their wheels.
Benchmarks help you rank your problems, while user behavior data tells you what to change. You need both.
If your add-to-cart rate is sitting well below the benchmark for your particular industry, that tells you PDPs need more attention. But the benchmark doesn't tell you why your visitors aren't adding to cart. Is it confusion with pricing? Lack of trust signals? Poor product presentation? Unclear value proposition?
You’ll only answer those questions with qualitative research, heatmaps, session recordings, and user feedback. The benchmark just gets you pointed in the right direction.
The best CRO teams use benchmarks to position and search for references, not blindly follow what others are doing. Your funnel is unique. Your customers have specific hesitations. Generic “best practices” aren’t going to solve specific problems.
How to Actually Use These Benchmarks
Stop comparing yourself to the global averages. They mean nothing without context.
Instead, compare to brands with similar industry vertical, traffic volume, and funnel complexity. For example, a DTC brand selling $200 products to cold traffic has nothing at all in common with a subscription service converting warm email lists. So why would their benchmarks be compared? They shouldn’t be.
Break your funnel into benchmarkable stages:
Homepage → PDP
PDP → Add to Cart
Cart → Checkout
Checkout → Purchase
Each stage has different user intent levels, different friction points, and different optimization levers. Putting them all together will guarantee you miss where the real problems are.
Benchmark mobile separately. This cannot be overstated. Mobile performance is where the biggest revenue leaks tend to hide. It MUST be treated as an entirely different experience, not just the same thing happening on a smaller screen. The 80%+ abandonment rate on mobile isn't because mobile users aren’t as interested, it's because mobile experiences are often worse.
Use benchmarks to rank problems, not to fix them. Once you know which stage is underperforming, dig a little deeper with user behavior data. Watch session recordings. Read user survey responses. Try to understand why users drop off, not just where.
Prioritize the stage closest to purchase, after you fix upstream leaks. Cart and checkout optimizations really work best when PDPs are already doing their job. If nobody's adding products to the cart, fixing your checkout flow makes about as much sense as rearranging deck chairs on the Titanic.
The Compounding Effect of Benchmark-Driven CRO
Here's what happens you prioritize benchmark-driven testing:
You’ll run fewer experiments because you’re not guessing anymore. You’ll achieve higher win rates because you’re now solving real problems. And you get to see compounding gains over time instead of short-lived one-off spikes.
"Most revenue is lost before checkout, not during it," Fernandes notes.
"When you fix the upstream leaks first, everything downstream performs better. It compounds."
A 10% improvement in your add-to-cart rate means more users are entering the cart experience. A 10% improvement in your cart-to-checkout progression means that more users make it to checkout. And a 10% improvement in checkout completion obviously means more orders.
Stack those improvements and, just like that, your "bad" conversion rate doesn't look as bad anymore.
Stop Guessing, Start Diagnosing
The 2026 benchmarks are clear. Most e-comm brands lose the majority of their revenue before their visitors even make it to checkout.
Global averages hide this truth. Top-line CVR comparisons make brand owners feel bad without showing them exactly why. Page-level and funnel-stage benchmarks reveal the points where optimization actually matters.
The fact is, you don't need to test everything. You definitely don’t need to redesign your entire site in most cases. What you really need is to find the leak, understand why it exists, and then fix it once you have the full picture.
Benchmarks won't tell you what to change. But they will tell you precisely where to look.
And in 2026, with every one of your visitors costing more than before, knowing exactly where to look first is how you’re going to survive.